
What the world’s largest EM credit dataset reveals about real risk in emerging markets

1. Why this dataset matters now
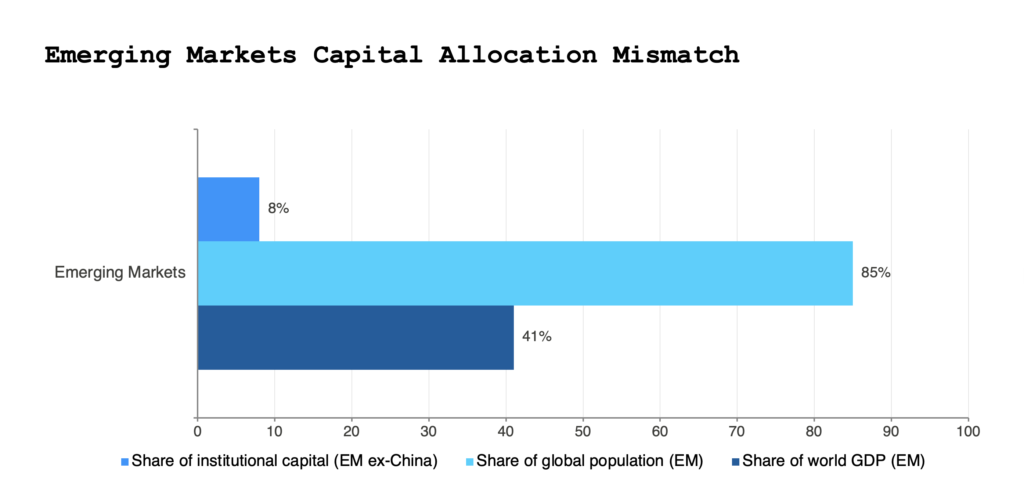
Emerging markets account for a significant share of both growth and investment need worldwide, yet they attract only a small fraction of global institutional capital. This persistent imbalance reflects a long‑standing problem: The pricing of credit risk in emerging markets is based on outdated information without a strong foundation in long‑run evidence.1
Without such evidence, investors have largely relied on perception, resulting in emerging markets consistently being treated as inherently more volatile, unpredictable and structurally risky than their developed counterparts.2 This dynamic has led to elevated risk premiums and constrained capital flows in developing countries,3 especially in their energy and infrastructure sectors, given their substantial financing needs and long time horizons.
In today’s development environment, this dynamic could not be more consequential. Emerging markets are tasked with a generational mandate:4 expand energy access, build new infrastructure and facilitate an energy transition, among an array of other developmental pursuits. Without the consistent long-term capital necessary to carry it out,5 governments are under pressure to reduce borrowing costs,6 and MDBs are being asked to stretch their balance sheets and crowd in private capital,7 yet all three face the
same constraint: Risk is being priced conservatively in emerging markets despite there being no shared empirical view of how their credit has actually performed over time.8
The Global Emerging Markets Risk Database (GEMs) has the potential to resolve this constraint. Decades’ worth of data on realized credit performance — now publicly available — is finally replacing long-standing assumptions with tangible evidence, laying the groundwork for a more sensible discussion of risk when it comes to investment in emerging markets.
2. How GEMs came about, and how the data became public
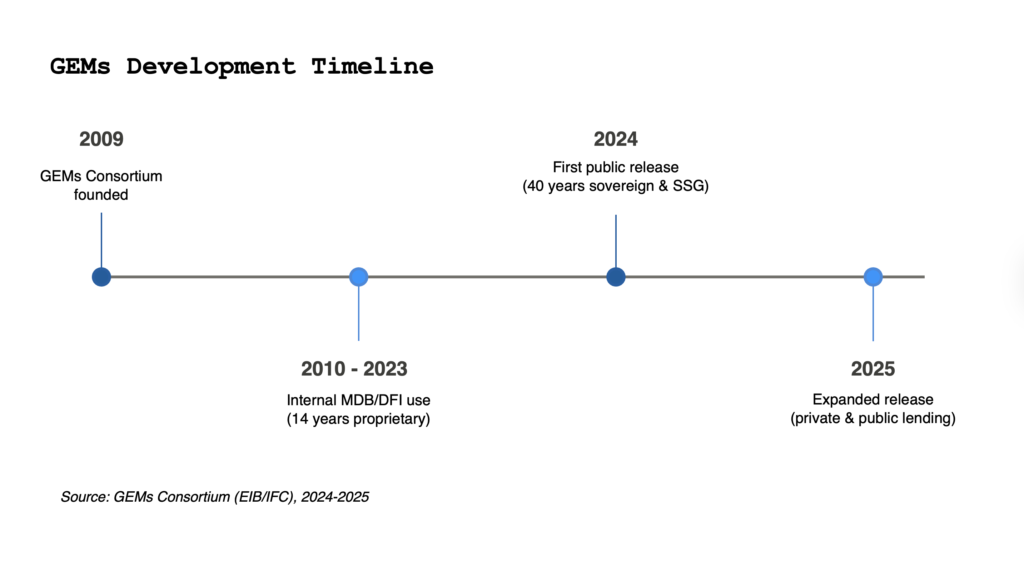
The GEMs Consortium was established in 2009 by the European Investment Bank and IFC before steadily expanding to encompass most of the world’s major multilateral development banks and development finance institutions.9 Its mandate was simple: to create the world’s most comprehensive database of defaults, recoveries and credit migrations in emerging markets.10 For over a decade, GEMs served as a purely internal tool, with member MDBs using it to calibrate pricing, risk weights and provisions.
The case for the database to be publicly accessible mounted steadily alongside pressure to mobilise private capital. Investors increasingly argued that, without adequate historical data, they would maintain their sweeping assumptions about emerging markets.11 The need for greater transparency was demonstrated clearly over time by G20 discussions, shareholder dialogues and independent reviews of MDBs’ capital adequacy frameworks.
In 2024, there was a major shift. The consortium released its first major tranche of sovereign and sovereign‑guaranteed data covering a 40‑year period from 1984.12 This was followed by the publication of private and public lending statistics covering roughly 30 years of lending from 1994 and capturing approximately 15,000 private‑sector loans.13
In 2025, MDBs began to expand on these releases, publishing more accessible summaries, methodological notes and sector‑specific insights. Through such publications, the dataset that had been used internally for 15 years was finally being made available to investors, analysts and policymakers.
3. What the data say about risk in emerging markets
GEMs’ most significant contribution lies in the ability it grants to determine how credit risk in emerging markets has actually behaved over time, including during multiple global crises.14 The database enabled investors to compare long‑run realised performance with the long‑standing assumption that emerging markets are inherently volatile, prone to defaults and unpredictable relative to advanced economies. Through such comparisons, investors finally realised that the evidence tells a different, more nuanced story.
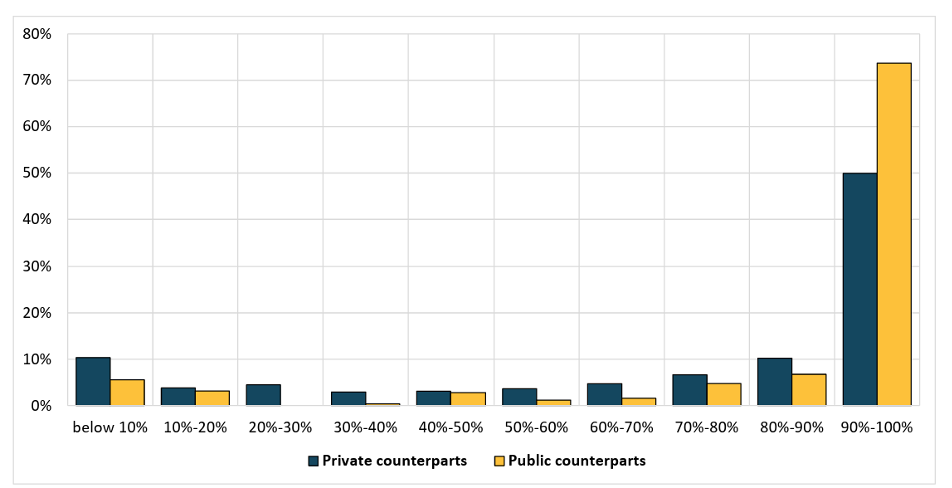
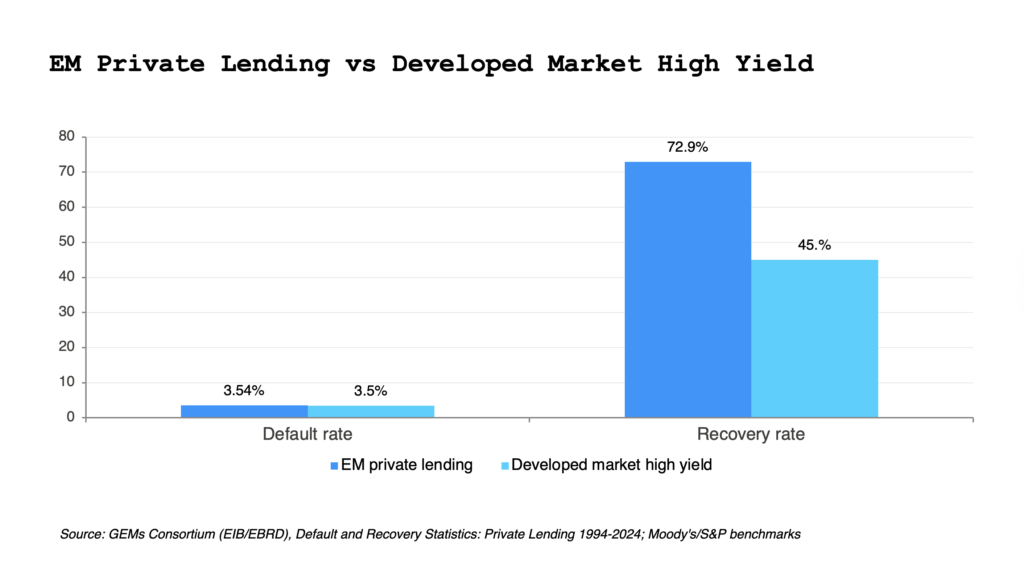
In terms of private lending, GEMs shows that the average annual default rate for private borrowers in emerging markets has been approximately 3.54 per cent over the past 30 years, corresponding to a BB or B+ S&P rating. At the same time, the average recovery rate has been around 72.9 per cent15, which could notch the issue-level rating to BB or even BB+, with median recovery rates even higher at above 90 percent16. Moreover, they exhibit higher recoveries than many global high‑yield benchmarks,17 indicating that realised losses have been far less severe than widely assumed.
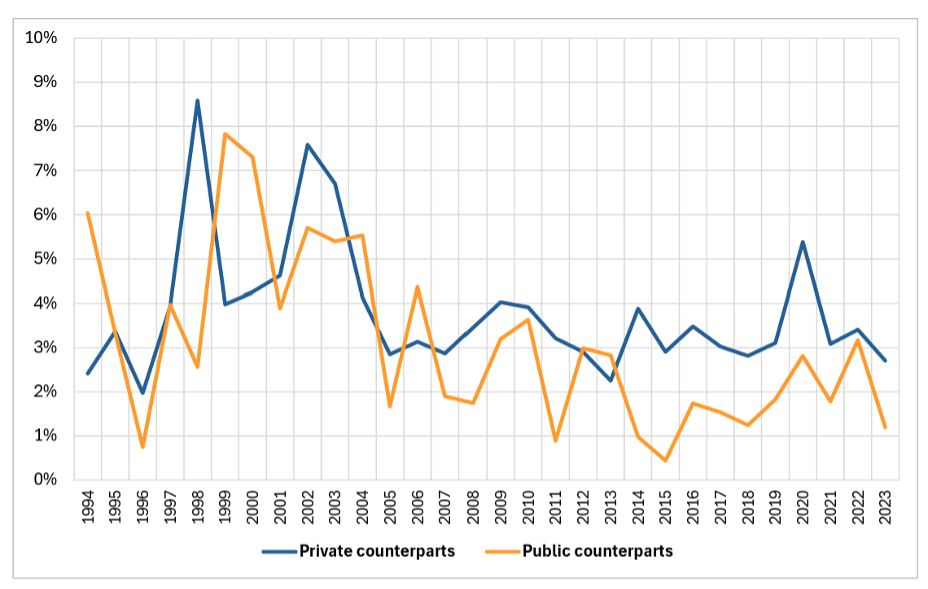
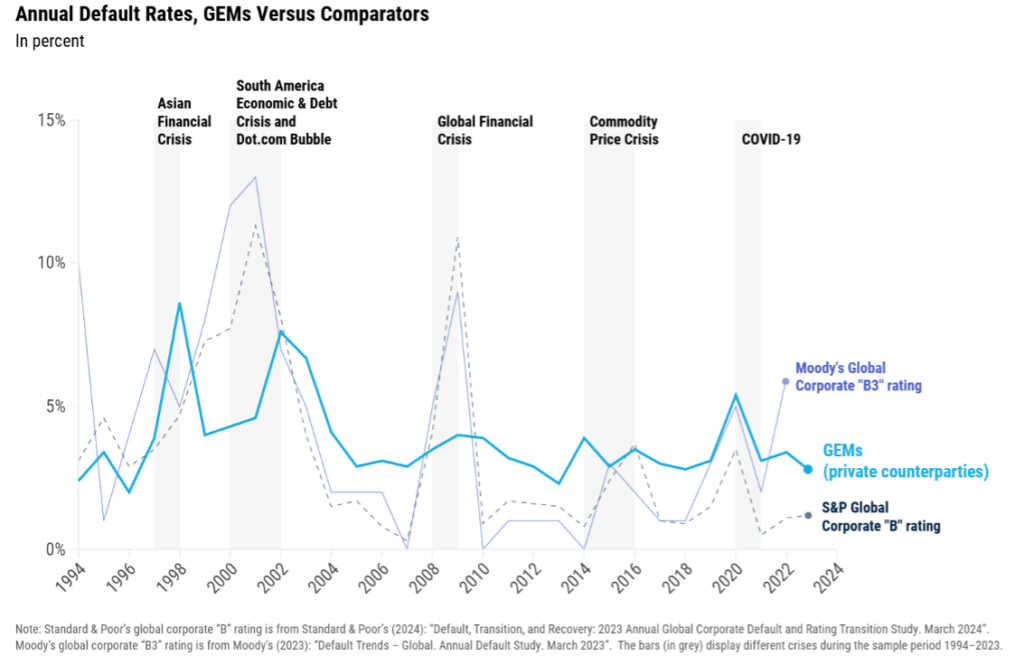
One of the dataset’s most striking aspects is the stability of outcomes over time. Despite the data encompassing the Asian financial crisis, the dot‑com bubble, the global financial crisis, the Eurozone crisis, the COVID-19 pandemic and the current period of heightened sovereign stress, the default rates consistently revert toward long-run averages over this 30-year period, rising during global or regional dislocations before stabilizing soon thereafter.18 In parallel, recovery rates have remained remarkably robust even during crises, a pattern reinforced by other GEMs publications indicating that recovery rates do not fall when defaults spike. This cyclicality of defaults paired with the stability of recoveries points to a level of resilience in emerging market credit that is often missing from narratives centred on their supposed volatility.
GEMs’ scale lends additional credibility to these conclusions. The dataset on private‑sector lending alone draws from more than 15,000 loans to over 10,000 private entities across multiple regions and economic cycles19, generating a statistically meaningful picture of credit behaviour. IFC analysis of the GEMs data indicates that default patterns in emerging markets correlate moderately with S&P B‑rated and Moody’s B3‑rated firms in advanced economies20, suggesting that corporate credit in emerging markets behaves not as a fundamentally distinct entity but rather similarly to a familiar high‑yield asset class from advanced economies, and more specifically in upper-tier high yield rather than distressed credit. This High Yield allocation represents approximately $4-6 trillion globally.
Even the sovereign and sovereign‑guaranteed side of GEMs reflects this overall pattern of stability. Over a 40‑year period, sovereign and sovereign‑guaranteed loans exhibit an average annual default rate of 1.06 per cent and an average recovery rate of 94.9 per cent21, with recent publications revealing only a mild upward trend in default rates since 2022. These outcomes are far more benign than what emerging market risk premiums generally imply, demonstrating again that losses realised in practice have diverged significantly from perceived risk.
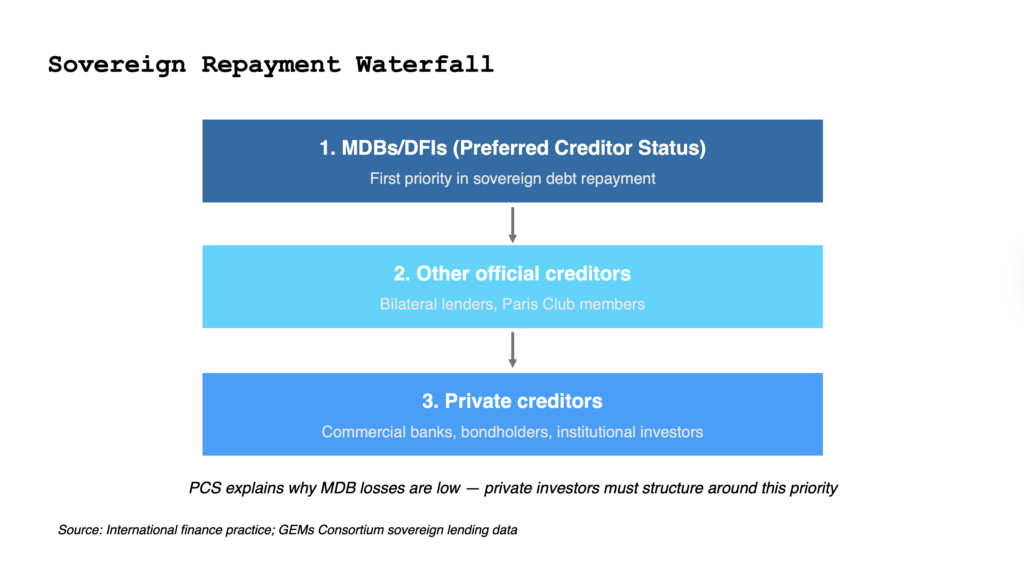
This dynamic holds true for the energy and infrastructure sectors, which are generally considered to constitute the backbone of emerging market development.22 According to GEMs data on private lending, renewable energy projects in emerging markets have exhibited an average annual default rate of just 3.27 per cent and a median recovery rate of 64.5 per cent between 1994 and 202323, closely aligning with the performance of infrastructure debt in advanced economies. Public infrastructure that is sovereign or sovereign‑guaranteed benefits from another important factor: the preferred creditor status of MDBs and DFIs.24 Sovereigns consistently prioritise repayments to these institutions — even when in distress25 — contributing to their very low realised loss profiles. While private investors cannot rely on the same protections, the data demonstrate that governments consider infrastructure obligations to MDBs to be systemically and developmentally important26, giving way to the prominence of guarantees, political risk insurance and carefully structured offtake agreements in the design of private transactions.
Ultimately, GEMs data reveal that private‑sector infrastructure firms behave largely in line with global non‑investment-grade assets in advanced economies27, reinforcing the fact that emerging market infrastructure risk is not as exceptional as has been historically assumed. Rather, it sits squarely in line with a risk category that is familiar to investors28. This alignment is particularly fruitful, as infrastructure assets pose several advantages for global institutional investors. Most notably, energy and infrastructure projects present opportunities for large-scale investments, helping investors to meet their ticket size requirements. Moreover, these projects typically boast long-term investment horizons, aiding in the construction of portfolios with reliable returns in the long run. The knowledge that such assets in emerging markets perform in line with established high-yield asset classes should enable institutional investors to leverage them in the sectoral and geographical diversification of their portfolios.
Together, these insights paint a consistent picture. Credit in emerging markets, be it private, public or sovereign, has exhibited a level of long-run predictability and resilience that contrasts sharply with long-standing assumptions. Defaults certainly occur — as they do in all markets — but they occur within a relatively narrow band; recoveries are strong and stable. Multi‑decade patterns reveal cyclicality, not structural instability. Finally, the difference between public and private performance indicates that emerging markets are not a monolith; they encompass a diverse set of credits that behave differently depending on a wide array of factors, as in advanced economies.
4. Key takeaways from the GEMs data
1. Credit in emerging markets behaves like the global high‑yield asset class, not an uncharted frontier.
IFC analysis indicates that default patterns in emerging markets correlate moderately with S&P B‑rated and Moody’s B3‑rated firms in advanced economies29, indicating that emerging market credit occupies a risk profile that is already well understood by global investors.
2. This alignment holds true for the energy and infrastructure sectors, presenting a valuable opportunity for global institutional investors.
The ability to more reliably quantify asset risk in these emerging market sectors enables investors to diversify their portfolios both sectorally and geographically. Moreover, these assets typically represent large-scale opportunities — helping investors to meet their ticket size requirements — with long-term investment horizons.
3. Recoveries in emerging markets have been stronger than expected, with public-sector lending outperforming private-sector lending.
With recoveries at 72.9 per cent on private loans, realised losses have been smaller than those suggested by typical emerging market spreads. Public-sector borrowers exhibit a lower default rate (2.61 per cent) than private-sector borrowers (3.54 per cent) and significantly higher recoveries (85.8 per cent versus 72.9 per cent)30. Evidently, sovereign‑linked and infrastructure credit have historically been safer than indicated by long-standing assumptions.31
4. Stability amid crisis represents a defining feature of the GEMs data.
From 1994 to 2023, despite an array of crises, default rates consistently reverted toward long‑run averages, and recovery rates remained stable, reflecting the structural resilience of credit in emerging markets.32 Moderate correlations with high‑yield cycles in advanced economies indicate that emerging market credit is neither uniquely fragile nor structurally unstable.33
5. Sovereign lending and sovereign‑guaranteed lending exhibit extremely low loss rates.
The long‑run sovereign default rate over the considered 40-year period of just 1.06 per cent with an average recovery rate of 95 per cent34 challenges the pricing implied by sovereign spreads, however it is impacted by MDB’s preferred creditor status and strong policy engagement.
6. The perception gap has distorted capital allocation for decades.
The combination of stable defaults, strong recoveries, multi‑crisis resilience and public‑sector outperformance suggests that credit risk in emerging markets has been priced above what is supported by the data.
5. GEMs’ influence on MDBs’ capital adequacy frameworks and ratings conversations
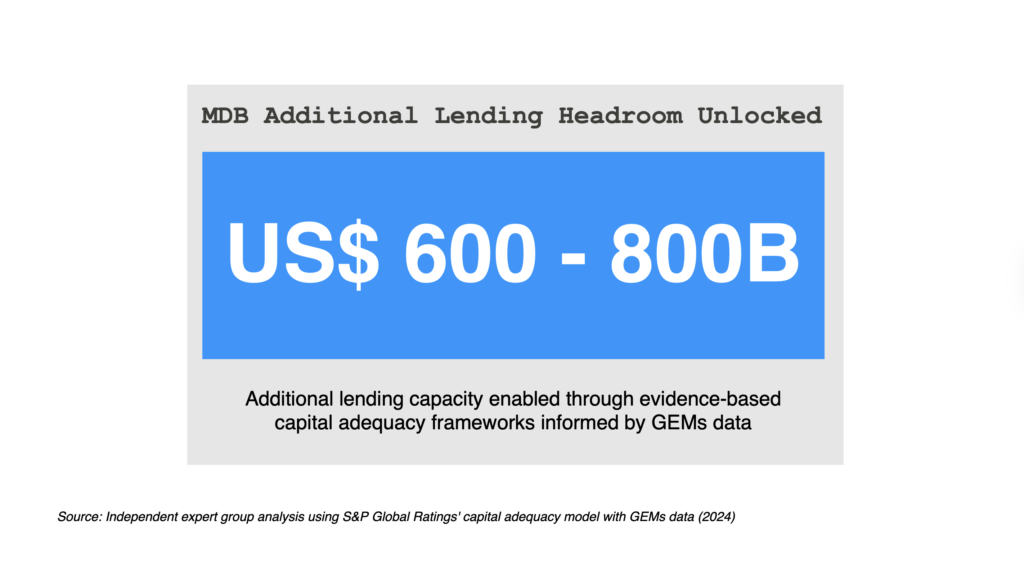
The most immediate and tangible shift stemming from the GEMs disclosure came in the form of MDBs’ analysis of balance sheets. A G20-commissioned independent expert group applied S&P Global Ratings’ capital adequacy model to MDB portfolios using the newly released GEMs data and found that MDBs could expand their lending by roughly 600–800 billion dollars in the medium term using existing equity while maintaining their high credit ratings35. In essence, the accuracy of the GEMs data enables S&P’s model to recognise that realised risk is lower than previous assumptions, creating additional lending headroom without any change in shareholder capital.
This means neither that S&P has upgraded MDB ratings in response to GEMs nor that such upgrades are imminent. Rather, following the incorporation of long‑run evidence into their modelling frameworks, MDBs’ rating methodologies are increasingly able to differentiate between perceived emerging market risk and demonstrated credit performance. This has implications for not only MDBs but also the cost of mobilising private capital alongside them. This also means that with the current balance sheet the MDB’s have the ability to take more risk, something that continues to be top of mind in development finance in order to have limited concessional dollars go further and be an enabler to unlocking private capital.
MDBs and DFIs have begun to highlight these findings in their public communications, noting that the evidence from GEMs challenges prevailing narratives about credit stress in emerging markets, strengthening the case for greater private investment into emerging market projects.36
6. What this means going forward
The gradual release of the GEMs data is beginning to reshape how risk in emerging markets is understood, challenging long-standing assumptions and helping investors to price evidence rather than uncertainty. For MDBs, GEMs supports the more efficient use of existing capital by demonstrating that their historic losses are far less severe than had previously been modelled. For private investors, it introduces a solid baseline for understanding risk in a way that is linked to real-world outcomes rather than skewed perceptions. For policymakers, it demonstrates that investments in emerging markets’ energy and infrastructure sectors may be structured in such a way that achieves predictable credit performance.
The implications here are significant. If MDBs can truly expand lending capacity by hundreds of billions of dollars in the medium term using existing equity, and if private investors become more comfortable now that they have a clearer risk–return profile available, then much larger capital flows into emerging markets’ energy transitions and infrastructure development may be possible.
Critically, however, important obstacles remain. The data publicly released thus far have yet to provide the level of sectoral granularity that investors would find most valuable37. More anonymised, sector‑level statistics would enable investors to apply these insights more directly to the assets they are evaluating. While achieving such granularity would present numerous practical difficulties, its returns would more than make up for the effort.
Despite these obstacles, the trend is clear: The more data is disclosed, the harder it becomes to justify treating emerging markets as uniformly high-risk. Evidence shows that the long‑run behaviour of credit in emerging markets, including in the energy and infrastructure sectors, is far closer to global benchmarks than has historically been reflected by market pricing. Investors who engage early with this emerging evidence are likely to find opportunities that have been overlooked up to this point simply because the data were not previously available.
Footnotes
1 UN News. (2026, March 30). Developing countries are being priced out, in struggle for affordable finance. https://news.un.org/en/story/2026/03/1167219. ↩
2 Galizia, F., & Lund, S. (2024). Reassessing risk in emerging market lending: Insights from GEMs Consortium statistics. International Finance Corporation. https://openknowledge.worldbank.org/entities/publication/ebfac24b-1923-42c5-82bb-c61f151c9b18 ↩
3 UN News. (2026, March 30). Developing countries are being priced out, in struggle for affordable finance. https://news.un.org/en/story/2026/03/1167219 ↩
4 UN Conference on Trade and Development. (n.d.). The costs of achieving the Sustainable Development Goals. Retrieved April 5, 2026, from https://unctad.org/sdg-costing ↩
5 G20, & OECD. (2024). G20/OECD report on assessing and promoting capital flow resilience in emerging markets and developing economies: Evidence on drivers and policy implications. https://www.oecd.org/content/dam/oecd/en/publications/reports/2024/11/g20-oecd-report-on-assessing-and-promoting-capital-flow-resilience-in-emerging-markets-and-developing-economies_3864338c/b261bbe7-en.pdf ↩
6 UN Conference on Trade and Development. (2026, March 19). The rising cost of debt is squeezing development prospects in many countries. https://unctad.org/news/rising-cost-debt-squeezing-development-prospects-many-countries ↩
7 World Bank Group. (2015, June 16). Multilateral development banks provided $28 billion in climate finance in 2014. https://www.worldbank.org/en/news/press-release/2015/06/16/mdbs-provided-28-billion-climate-finance-2014 ↩
8 UN News. (2026, March 30). Developing countries are being priced out, in struggle for affordable finance. https://news.un.org/en/story/2026/03/1167219 ↩
9 Global Emerging Markets Risk Database. (n.d.) Global Emerging Markets Risk Database (GEMs). Retrieved April 5, 2026, from https://www.gemsriskdatabase.org/ ↩
10 Global Emerging Markets Risk Database. (n.d.) About us. Retrieved April 5, 2026, from https://www.gemsriskdatabase.org/our-guiding-principles/ ↩
11 Mathiasen, K., & Martinez, N. (2025). GEMs and the 600–800 billion dollar data dividend. Center for Global Development. https://www.cgdev.org/publication/gems-and-600-800-billion-dollar-data-dividend ↩
12 Mathiasen, K., & Martinez, N. (2025). GEMs and the 600–800 billion dollar data dividend. Center for Global Development. https://www.cgdev.org/publication/gems-and-600-800-billion-dollar-data-dividend ↩
13 European Investment Bank. (2025, October 7). New statistics from GEMs Consortium show risk of investing in emerging markets is lower than commonly perceived. https://www.eib.org/en/press/all/2025-366-new-statistics-from-gems-consortium-show-risk-of-investing-in-emerging-markets-is-lower-than-commonly-perceived; Public–Private Infrastructure Advisory Facility. (2024). Financial performance of infrastructure investment: Based on EDHECInfra, GEMs, FTW GLIO, Moody’s, MSCI, and S&P data. World Bank Group. https://cdn.gihub.org/umbraco/media/5545/section-3_financial-performance-of-infrastructure-investment_monitor-2024.pdf ↩
14 EBRD Press Office. (2025, October 15). New GEMs Consortium publications offer insights into emerging market credit risk. European Bank for Reconstruction and Development. https://www.ebrd.com/home/news-and-events/news/2024/new-gems-consortium-publications-offer-insights-into-emerging-market-credit-risk.html; European Investment Bank. (2025, October 7). New statistics from GEMs Consortium show risk of investing in emerging markets is lower than commonly perceived. https://www.eib.org/en/press/all/2025-366-new-statistics-from-gems-consortium-show-risk-of-investing-in-emerging-markets-is-lower-than-commonly-perceived ↩
15 European Investment Bank. (2025, October 7). New statistics from GEMs Consortium show risk of investing in emerging markets is lower than commonly perceived. https://www.eib.org/en/press/all/2025-366-new-statistics-from-gems-consortium-show-risk-of-investing-in-emerging-markets-is-lower-than-commonly-perceived; Mathiasen, K., & Martinez, N. (2025). GEMs and the 600–800 billion dollar data dividend. Center for Global Development. https://www.cgdev.org/publication/gems-and-600-800-billion-dollar-data-dividend ↩
16 EBRD Press Office. (2025, October 15). New GEMs Consortium publications offer insights into emerging market credit risk. European Bank for Reconstruction and Development. https://www.ebrd.com/home/news-and-events/news/2024/new-gems-consortium-publications-offer-insights-into-emerging-market-credit-risk.html ↩
17 EBRD Press Office. (2025, October 15). New GEMs Consortium publications offer insights into emerging market credit risk. European Bank for Reconstruction and Development. https://www.ebrd.com/home/news-and-events/news/2024/new-gems-consortium-publications-offer-insights-into-emerging-market-credit-risk.html; European Investment Bank. (2025, October 7). New statistics from GEMs Consortium show risk of investing in emerging markets is lower than commonly perceived. https://www.eib.org/en/press/all/2025-366-new-statistics-from-gems-consortium-show-risk-of-investing-in-emerging-markets-is-lower-than-commonly-perceived ↩
18 Mathiasen, K., & Martinez, N. (2025). GEMs and the 600–800 billion dollar data dividend. Center for Global Development. https://www.cgdev.org/publication/gems-and-600-800-billion-dollar-data-dividend ↩
19 European Investment Bank. (2025, October 7). New statistics from GEMs Consortium show risk of investing in emerging markets is lower than commonly perceived. https://www.eib.org/en/press/all/2025-366-new-statistics-from-gems-consortium-show-risk-of-investing-in-emerging-markets-is-lower-than-commonly-perceived; Mathiasen, K., & Martinez, N. (2025). GEMs and the 600–800 billion dollar data dividend. Center for Global Development. https://www.cgdev.org/publication/gems-and-600-800-billion-dollar-data-dividend ↩
20 Mathiasen, K., & Martinez, N. (2025). GEMs and the 600–800 billion dollar data dividend. Center for Global Development. https://www.cgdev.org/publication/gems-and-600-800-billion-dollar-data-dividend ↩
21 EBRD Press Office. (2025, October 15). New GEMs Consortium publications offer insights into emerging market credit risk. European Bank for Reconstruction and Development. https://www.ebrd.com/home/news-and-events/news/2024/new-gems-consortium-publications-offer-insights-into-emerging-market-credit-risk.html ↩
22 Zondo, C. (2024). The role of infrastructure in driving economic development in emerging markets. Journal of Economics and Economic Education Research, 25(S6), 1–3. https://www.abacademies.org/articles/the-role-of-infrastructure-in-driving-economic-development-in-emerging-markets-17368.html ↩
23 Global Emerging Markets Risk Database. (2024). Default and recovery statistics: Private and public lending 1994–2023.https://www.eib.org/files/publications/20240217_default_and_recovery_statistics_private_and_public_lending_1994_2023_en.pdf ↩
24 Mathiasen, K., & Martinez, N. (2025). GEMs and the 600–800 billion dollar data dividend. Center for Global Development. https://www.cgdev.org/publication/gems-and-600-800-billion-dollar-data-dividend ↩
25 European Parliamentary Research Service. (2024). Multilateral development banks: State of play and reform proposals. European Parliament. https://www.europarl.europa.eu/RegData/etudes/BRIE/2024/762477/EPRS_BRI(2024)762477_EN.pdf ↩
26 Public–Private Infrastructure Advisory Facility. (2024). Financial performance of infrastructure investment: Based on EDHECInfra, GEMs, FTW GLIO, Moody’s, MSCI, and S&P data. World Bank Group. https://cdn.gihub.org/umbraco/media/5545/section-3_financial-performance-of-infrastructure-investment_monitor-2024.pdf ↩
27 EBRD Press Office. (2025, October 15). New GEMs Consortium publications offer insights into emerging market credit risk. European Bank for Reconstruction and Development. https://www.ebrd.com/home/news-and-events/news/2024/new-gems-consortium-publications-offer-insights-into-emerging-market-credit-risk.html ↩
28 Mathiasen, K., & Martinez, N. (2025). GEMs and the 600–800 billion dollar data dividend. Center for Global Development. https://www.cgdev.org/publication/gems-and-600-800-billion-dollar-data-dividend ↩
29 Mathiasen, K., & Martinez, N. (2025). GEMs and the 600–800 billion dollar data dividend. Center for Global Development. https://www.cgdev.org/publication/gems-and-600-800-billion-dollar-data-dividend ↩
30 European Investment Bank. (2025, October 7). New statistics from GEMs Consortium show risk of investing in emerging markets is lower than commonly perceived. https://www.eib.org/en/press/all/2025-366-new-statistics-from-gems-consortium-show-risk-of-investing-in-emerging-markets-is-lower-than-commonly-perceived ↩
31 European Investment Bank. (2025, October 7). New statistics from GEMs Consortium show risk of investing in emerging markets is lower than commonly perceived. https://www.eib.org/en/press/all/2025-366-new-statistics-from-gems-consortium-show-risk-of-investing-in-emerging-markets-is-lower-than-commonly-perceived ↩
32 European Investment Bank. (2025, October 7). New statistics from GEMs Consortium show risk of investing in emerging markets is lower than commonly perceived. https://www.eib.org/en/press/all/2025-366-new-statistics-from-gems-consortium-show-risk-of-investing-in-emerging-markets-is-lower-than-commonly-perceived ↩
33 European Investment Bank. (2025, October 7). New statistics from GEMs Consortium show risk of investing in emerging markets is lower than commonly perceived. https://www.eib.org/en/press/all/2025-366-new-statistics-from-gems-consortium-show-risk-of-investing-in-emerging-markets-is-lower-than-commonly-perceived ↩
34 EBRD Press Office. (2025, October 15). New GEMs Consortium publications offer insights into emerging market credit risk. European Bank for Reconstruction and Development. https://www.ebrd.com/home/news-and-events/news/2024/new-gems-consortium-publications-offer-insights-into-emerging-market-credit-risk.html ↩
35 G20. (2022). Boosting MDBs’ investing capacity: An independent review of multilateral development banks’ capital adequacy frameworks. https://www.dt.mef.gov.it/export/sites/sitodt/modules/documenti_it/news/news/CAF-Review-Report.pdf; Mathiasen, K., & Martinez, N. (2025). GEMs and the 600–800 billion dollar data dividend. Center for Global Development. https://www.cgdev.org/publication/gems-and-600-800-billion-dollar-data-dividend ↩
36 African Development Bank Group. (2026, February 9). 5 things to know about GEMs. https://www.afdb.org/en/news-and-events/5-things-know-about-gems-90696 ↩
37 Mathiasen, K., & Martinez, N. (2025). GEMs and the 600–800 billion dollar data dividend. Center for Global Development. https://www.cgdev.org/publication/gems-and-600-800-billion-dollar-data-dividend ↩
Related Insights
View all-
 CrossBoundary Group10.12.2024Article
Q&A with CrossBoundary Managing Partners
-
 CrossBoundary Group26.08.2024Article
Unlocking the potential of blended finance in Asia
-
 CrossBoundary Advisory03.08.2023White paper
PPA Bankability in Africa: Moving away from Sovereign Guarantees and the Rise of Energy Intermediaries